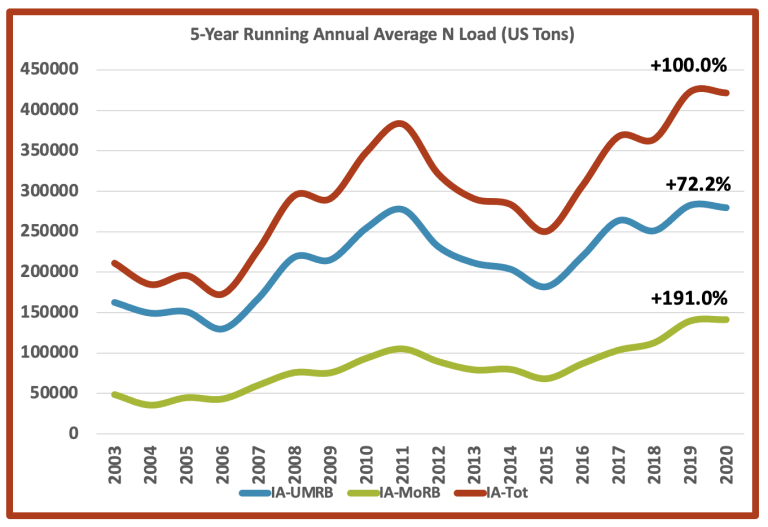
In his March 1, 2021 post, Jones compiled data from the monitoring of Iowa watersheds since 2003. His post documents his data sources and explains his methodology. The graph above shows the amount of nitrogen being discharged from Iowa on the major rivers. The green line is the rivers discharging to the Missouri River, and the blue line is the rivers going directly to the Upper Mississippi. The red line is the total discharge. Jones' data shows that the total nitrogen discharge has doubled since 2003.
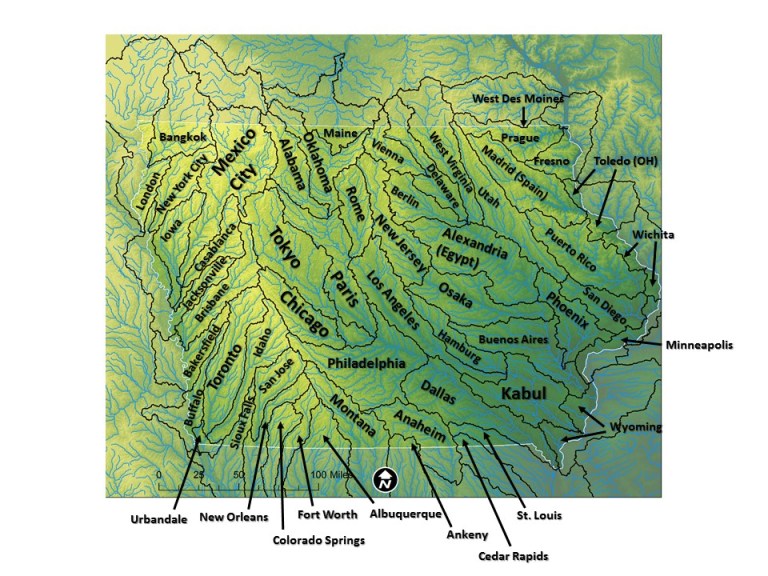
In 2019, Jones wrote a post that compared the impact of the population of livestock to the human population of major cities. Our speaker at the UMRR session, David Osterberg, quoted Chris Jones as he talked about the need for a stronger approach to nutrient management. You can watch the video of Osterberg's talk via the link in this UMRR Blog post. Chris Jones' blog post that Osterberg quoted is found at this link.
0 Comments
Leave a Reply. |
| LWV Upper Mississippi River Region | UMRR blog |


 RSS Feed